The Least Surprising Part of Chris Sale's October Was the October
The Wild Card bookend, 19 outs in Game 1, the last four in Game 3, looked like clutch mythology. The season-long evidence says it was form.

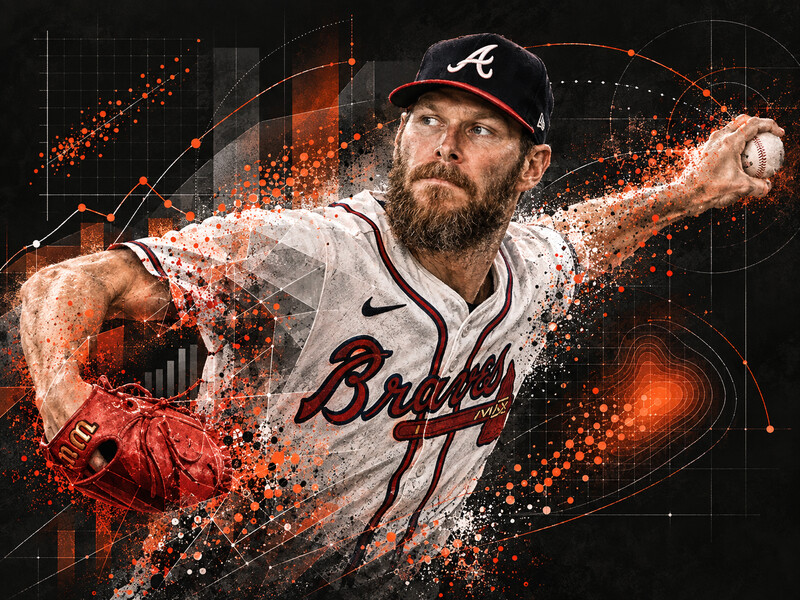
Before Game 3 of the Wild Card Series, Chris Sale walked into Walt Weiss’s office unprompted and said, “I feel amazing.” That’s the whole medical file. Per MLB.com, Weiss was confident enough in Sale’s word that he didn’t need convincing, and a day after Sale had recorded the Braves’ first 19 outs in a 5-3 Game 1 win over Philadelphia, he came back out of the bullpen to get the final four outs of a 6-2 clincher.
The coverage has treated this as a willpower story, a 37-year-old dragging himself off the injury scrap heap for two acts of October defiance. I want to argue something less romantic and more interesting: the two games were the least surprising part. Sale’s 2026 was elite from April onward, it was earned by the underlying process rather than batted-ball luck, and the measurable parts of his game were sharpening, directionally, at least, right as the calendar turned. The feat wasn’t a spike. It was a season cashing out.
This is the bookend moment itself, Sale, who started Game 1, emerging from the bullpen in Game 3 to face Bryce Harper, the exact two-role gambit this article argues was earned by his elite 2.16 ERA season rather than adrenaline.
A season that made two games look routine
Start with the baseline, because the baseline is the story. Sale finished 2026 with a 2.16 ERA against a career mark of 2.95, at age 37, he beat his own Hall of Fame-track standard by nearly eight-tenths of a run. The supporting numbers say the same thing in different dialects: a 0.98 WHIP under his career figure, an 11.07 K/9 that essentially matches his career strikeout rate, a 2.1 ERA over his last ten starts. This was not a pitcher limping into the postseason and summoning something. The form was already there, and it had been there for months.
It also fit the role Atlanta handed him. Sale’s first innings were the cleanest contact window of his season, a 1.33 first-inning ERA, down from 3.15 a year ago, with no first-inning runs in 23 of his 27 starts. That’s the profile of a Game 1 tone-setter, with one honest footnote: by OPS, his first innings (.609) were actually unremarkable against his own standard, since his first-time-through mark overall was .576. He wasn’t uniquely great in the first. He was great everywhere, and the first inning simply wasn’t an exception.
There’s historical texture here too, per MLB.com: Sale became the first pitcher to start Game 1 of a postseason series and finish that same series since he did it himself for Boston in the 2018 World Series, and only he and Clayton Kershaw have done it multiple times. A neat piece of trivia. The more useful question is whether the season underneath it was real.
Run the luck audit
A 37-year-old beating his career ERA by nearly eight-tenths of a run should trigger skepticism on contact. The usual culprits are a lucky strand rate, a friendly BABIP, or results outrunning the expected-stats models. So run the audit.
Is the 2.16 ERA Earned? The Sustainability Audit
Regression indicators across 648 PA, 2026 season
Every major indicator comes back clean, and this is on a real sample, 648 plate appearances, 407 balls in play. The ERA-FIP gap is -0.129, which is negligible; the fielding-independent model sees roughly the same pitcher the scoreboard does. His .259 wOBA against sits within .008 of his .267 expected figure. And his BABIP against is .305, above the league average of .2915. If anything, Sale ran slightly unlucky on balls in play. There is no batted-ball fortune propping up this season.
The one amber light is the 81.4% strand rate, down slightly from 82.6% a year ago. That is the one number that would cost him runs if it slips. The mitigating case is the profile itself: a pitcher striking out 11.07 per nine is the kind who tends to sustain strand rates, because he can end innings without the ball in play. Worth watching, not worth panicking over, though I’d note his last three starts carried a 2.9 ERA, a touch above the last-ten figure, and his 24.5% line-drive rate allowed is a mild forward risk. Still below his career ERA. Still clean.
Where the bite came back
So the results are earned. The mechanism question is how, and the honest answer starts with something strange: Sale’s velocity readings went up at 37. The four-seam gained 1.4 mph year over year, a jump above the 90th percentile of historical year-over-year changes. The sinker gained 1.6, above the 95th percentile, the kind of jump that almost never happens at this age. The changeup gained 1.7. Slider spin rose 174 rpm, also above the 95th percentile. These are measured readings, not projections, and pitchers this age simply do not post them often.
The obvious next sentence, “he changed something mechanically”, isn’t supported. His release point and extension are unchanged, and the data does not identify where the gains came from. I’m not going to invent a delivery tweak to tidy the story. The readings rose. The origin is unresolved. Both of those things can be true.
What’s not ambiguous is where the gains cashed out.
The Arsenal, 2025 vs 2026
Usage and effectiveness, year over year
Look at the four-seam row. Whiff rate up from 21.1% to 27.7%, xwOBA against down from .348 to .299, on usage that barely moved, 41.7% to 40.8%. When a pitch improves at identical exposure, you can rule out the sequencing trick of simply showing it less. Hitters saw the same amount of fastball and missed more of it, on strong samples both years (1,098 pitches this season against 846 last). That coincides with the pitch gaining 1.4 mph and 84.2 rpm, which is at least a coherent shape even if the cause stays unnamed.
But “rejuvenated” is too clean a verdict, and the asymmetry matters: the four-seam’s improvement is in missing bats, not suppressing damage. It still allowed 9 home runs, up from 7, at a 92.1 mph average exit velocity, the loudest pitch in his arsenal.
The slider, meanwhile, ceded share, 47.3% usage down to 39.9%, and lost 2.1 inches of horizontal break, with its xwOBA ticking up from .196 to .217. Marginally less dominant than its 2025 version. It is still, unmistakably, the put-away weapon: a 39.7% whiff rate, best in the arsenal, zero home runs on 138 balls in play, and 51.7% usage in two-strike counts, where hitters chase 48.2% of the time. The swing data tells you why it keeps working, batters swing slower against it (66.9 mph bat speed versus a 70.9 competitive average) and longer (8.0 feet), which is the signature of a pitch being recognized late.
Then there’s the command, which barely counts as news for Sale but deserves the detail. His 4.8% walk rate ranks in the 96th percentile against a 9.5% league average, down from 6.3% last year. The interesting part is how: his zone rate actually fell, from 52.4% to 49.0%. He didn’t pound the strike zone. He got hitters to leave it, 37.1% chase overall, 48.2% with two strikes. That’s a pitcher commanding the edges well enough that the at-bat ends on his terms either way. Against his own career, the effect size here is small; this is a continuation of elite career command more than a new skill. The lone soft note is a first-pitch strike rate that slipped 1.1 points.
September, read carefully
Now the tempting part of the story. Did Sale actually sharpen into October?
The directional answer is yes. The statistical answer is: on 51 plate appearances. That window, his last 14 days of the regular season, is well inside noise range against the 626 plate appearances that came before, and nothing that follows should be read as established fact. What makes it worth showing anyway is the consistency of the direction.
The Late-Season Window vs the Baseline
Last 14 days vs rest of season small sample, consistent direction
Five metrics, all moving the same way. The sharpest mover is the strikeout rate, which climbed from 30.4% to 43.1% over that stretch, with whiffs and chases rising and the walks all but disappearing alongside it. And the short window matches the longer arc, his rolling 10-game xwOBA fell from .301 on July 10 to .231 by October 1. A small sample pointing the same direction as a half-season trend is more persuasive than either alone.
It still wasn’t uniform. A September 4 outing in that general stretch posted a .337 xwOBA, and the 14-day hard-hit rate (32.0%) is only modestly better than the earlier baseline (35.2%). One scope note matters too: these numbers describe the regular-season baseline Sale carried into the series, none of them describe Game 1 or Game 3 themselves. Call it what it is: a directional late surge, consistent across the board, resting on a sample too small to bank, and pointing exactly where the half-season trend was already pointing.
What the data can say about the bookend, and what it can’t
The bookend feat has two legs, and the data supports exactly one of them.
The leg it supports is depth. Sale recording 19 outs in Game 1 is consistent with a season-long durability signature that is genuinely unusual:
Pitch 90 Looks Like Pitch 10
Fastball velocity by pitch number, 2026
Across 1,323 fastball-family pitches this season, Sale’s velocity at pitch 76 and beyond averaged 96.3 mph (260 pitches), matching, actually fractionally exceeding, his average on pitches 1 through 25 (96.2, on 398 pitches). His third-time-through-the-order OPS gap versus the first time through is just .016. A pitcher who holds stuff and effectiveness that deep into games is the kind you let pitch into the seventh of a playoff game. That’s one inferential step, from in-game stamina to postseason workload, and it should be read as consistent with the feat, not proof it was coming.
The leg it does not support is the one the mythology leans on hardest: the recovery. The Game 3 return rests entirely on Sale saying “I feel amazing” and Weiss believing him. That’s not a knock, Weiss, per MLB.com, had run out of superlatives by then: “What a warrior, man... He’s one of the best I’ve ever been around.” But be clear-eyed about what kind of evidence that is. The most remarkable part of the story is the part no number verifies.
And the caution isn’t abstract. His third-time-through xwOBA (.278) is his worst split, mild as it is. More to the point, this is a pitcher whose back problems kept him out of the postseason entirely during his 2024 NL Cy Young season, the same body the Red Sox had essentially given up on when they sent him to Atlanta. That history doesn’t show up in any 2026 metric. It also doesn’t disappear because of one great October night.
The number the celebration missed
Uniformly adulatory coverage ran zero scrutiny on Sale’s actual contact profile this season. There is one number it would have found.
The Profile: Elite Command, Louder Contact
League percentile ranks, 2026
Read the contrast off those strips: 96th-percentile walk prevention sitting next to 44th-percentile exit velocity allowed. Hitters averaged 88.4 mph off Sale this year, up from 87.4 last season and 2.38 mph above his own 2021-26 window average. When they got a pitch middle-middle, they did real damage, a .610 slugging percentage at 94.4 mph average exit velocity on 53 balls in play, and the four-seam’s 9 home runs at 92.1 mph made it the loudest pitch he throws. Elite everywhere except where the ball gets hit.
Why is contact getting louder while everything else gets better? The candidate explanation is mix: fastball-family usage rose from 45.2% to 49.2% while the slider, the pitch nobody has homered off in 138 balls in play, ceded share. More fastball exposure, more loud contact. That’s an inference, a plausible one, not an established fact.
The reason this hasn’t shown up in the run column is that the extra exit velocity has been survivable. Barrel rate against is essentially unchanged (6.2% versus 6.3%, 72nd percentile), the ground-ball rate improved to 44.4%, and the wOBA against still sits at .259. Louder contact distributed into more grounders and no extra barrels is noise you can live with. It’s also the specific channel through which that 81.4% strand rate would start leaking runs if the batted-ball distribution ever stops cooperating.
So hold both things at once. The season was earned, the audit says so on every indicator. And the profile has exactly one soft spot, which the mix data gives him an obvious lever to address.
---
“I love pitching here in Atlanta,” Sale said afterward, per MLB.com. “I love pitching in front of these fans, and being able to do it in the postseason makes it that much more special.” The city will remember the bullpen door opening in Game 3, and it should. But the mechanism-level truth is less cinematic: a four-seam that got its whiffs back at unchanged usage, a slider hitters still can’t time, a walk rate in the 96th percentile built on chase rather than the zone, and a fastball that reads the same at pitch 90 as at pitch 10. The one-day-rest return was a leap of faith between a pitcher and his manager. Everything that made the leap plausible was on the Statcast ledger by June. Whoever faces him next shouldn’t prepare for a warrior. They should prepare for the fastball, and hope he leaves one middle-middle, because this season, that’s where the damage concentrated.