

We're having some technical issues.
Please come back later to see the best odds for today's games here.
MLBGame PreviewsLos Angeles Angels at San Francisco Giants
Los Angeles AngelsLos Angeles Angels
@
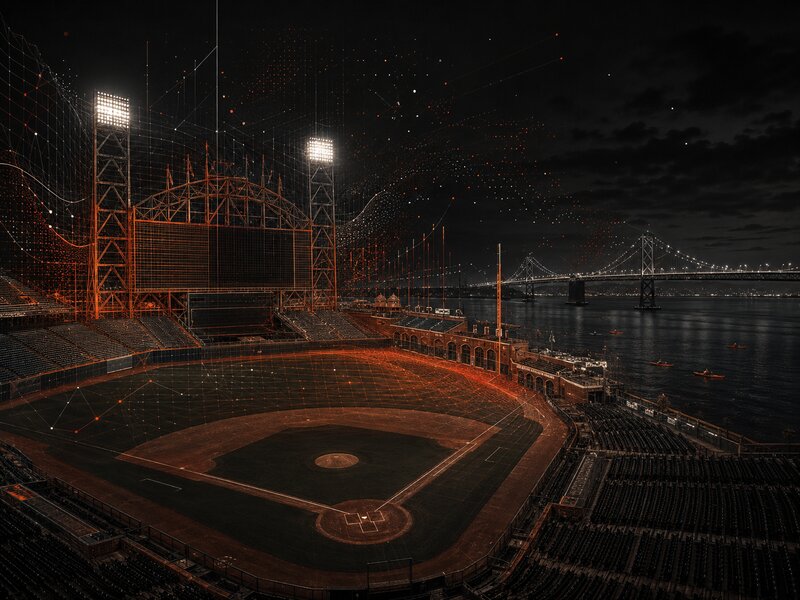
Oracle Park
San Francisco GiantsSan Francisco Giants

Match Predictor

Pre-match Prediction
Los Angeles Angels
@
San Francisco Giants
Los Angeles Angels 46%San Francisco Giants 54%
Market LinesRun Line: San Francisco Giants -0.5Total: O/U 9
Model: Under 9
Model projects 8.4 total runs vs 9 line

Los Angeles Angels

0022446688101012121414OVERUNDERO/U 9Runs ScoredRuns Allowed
All Over 9
38%
40/104
MLB: 48%
Starter
14%
1/7
vs SF
100%
1/1
Avg Total
9.2
MLB: 8.9
Game Starter (7) Last Starter vs SF vs SF (1)
Ryan Johnson #32 · RHP · Age 24
6.10
ERA (2026)
7.1
K/9 (2026)
7
Starts (2026)
7.6
Avg Total (2026)
Last 3:
W DET (Jul 19): 5.0IP, 1ER, 5K
ND @MIN (Jul 11): 5.0IP, 3ER, 1K
L BOS (Jul 05): 4.0IP, 2ER, 6K
vs SF: ND (Apr 19 2025): 1.1 IP, 0 ER, 0 K
Bullpen (2026 Season)Average
ERA: 3.65MLB Avg: 3.9510 relievers
Recent: W 3-2W 3-2W 5-1L 0-1L 6-7
Lineup vs Ryan Johnson (Career)
BatterPosPAAVGOPSHR
Heliot RamosLF1.0000.0000
12 batters with no matchup history

San Francisco Giants

0022446688101012121414OVERUNDERO/U 9Runs ScoredRuns Allowed
All Over 9
38%
39/104
MLB: 48%
Starter
32%
6/19
vs LAA
100%
1/1
Avg Total
8.8
MLB: 8.9
Game Starter (19) Last Starter vs LAA vs LAA (1)
Robbie Ray #38 · LHP · Age 35
3.33
ERA (2026)
7.8
K/9 (2026)
19
Starts (2026)
9.2
Avg Total (2026)
Last 3:
ND @SEA (Jul 19): 4.0IP, 1ER, 6K
ND COL (Jul 10): 5.0IP, 1ER, 4K
W @COL (Jul 04): 6.0IP, 3ER, 4K
Bullpen (2026 Season)Average
ERA: 3.77MLB Avg: 3.9510 relievers
Recent: L 3-6L 3-4L 2-3L 4-5W 7-6
Lineup vs Robbie Ray (Career)
BatterPosPAAVGOPSHR
Jorge SolerDH10.1430.5430
Mike TroutCF9.1430.9041
Jo AdellRF6.4000.9000
Vaughn Grissom2B3.0000.0000
Oswald Peraza2B2.0000.5000
8 batters with no matchup history
Our Top PicksLive Odds
Top PickSan Francisco Giants ML (-143) [LOW confidence>
Ray as a LHP at Oracle Park against a club that is 10-18 vs left-handers is the structural argument.
PickLos Angeles Angels +1.5 (-195) [MEDIUM confidence>
Both offenses rank bottom-20 in wRC+ and neither starter projects as a dominant run-suppressor through seven innings.
PickUnder 8.5 (-105) [LOW confidence>
Oracle Park's run factor (0.93) and HR factor (0.85) suppress scoring structurally against two bottom-20 offensive units.

Los Angeles Angels vs San Francisco Giants Game Preview

The story at Oracle Park this afternoon is the pitching matchup, and it pulls in two directions at once. Robbie Ray brings a 3.33 ERA into the start for the San Francisco Giants, which reads clean on the surface until you see 54 walks in 110.2 innings, a 4.39 BB/9 that makes every inning feel like threading a needle. Ray is not a pitcher you trust to cruise. But he is a left-handed pitcher at a suppressive park facing the Los Angeles Angels, a team that is 10-18 against left-handed pitching this season. That split is the decisive contextual edge, more than any ERA number on either side.

For Los Angeles, Ryan Johnson takes the ball with a 6.10 ERA and 10 home runs allowed in 38.1 innings in 2026, a rate of 2.35 per nine. That places him among baseball's most homer-prone starters. His most recent outing was genuinely better, 5 innings, 1 earned run, 5 strikeouts against Detroit, so this is not a pitcher in full collapse. But Oracle Park is where fly balls go to die. The cold bay wind off the water and an HR factor of 0.85 structurally suppress the home-run problem that defines his season. Whether that suppression holds depends on whether he can find his command early in today's MLB action.

Oracle Park is doing real contextual work here. A run factor of 0.93 and a HR factor of 0.85 are not decorative numbers. They penalize power-dependent offenses, and the Angels rely on power more than the Giants do. Two lineups ranking bottom-20 in wRC+ (Los Angeles at 96, San Francisco at 99) are not going to manufacture crooked numbers against a pitcher-friendly environment without some combination of Ray walking people into trouble or Johnson leaving a fastball in the middle of the zone.

The batter-versus-pitcher data offers one notable edge on each side. Jo Adell owns a .400 average and 0.900 OPS in 6 career plate appearances against Ray, the strongest career matchup advantage available to any hitter in the Los Angeles lineup. Drew Gilbert is the inverse. His vL OPS of 0.101 against left-handed pitching is not a cold week. It is a structural platoon collapse that makes him nearly invisible against a southpaw at this park. Context is everything here, and the context stacks toward San Francisco.

Los Angeles Angels vs San Francisco Giants Key Insights

  • Ray's 4.39 BB/9 (54 walks in 110.2 IP) is the game's single most important variable. Three walks in the first two innings and the total can climb regardless of Oracle Park's run suppression.
  • The Angels are 10-18 against left-handed pitching in 2026. Facing a LHP at Oracle Park stacks two concrete disadvantages directly against Los Angeles's lineup.
  • Johnson's outs prop is priced at 15.5 (-170 Under / +118 Over), signaling the market expects a relatively short outing. His recent five-inning efforts show he can survive the order once, but the HR rate compounds as the lineup turns over.
  • Both bullpens enter fully rested after Thursday's off day. Managers have maximum flexibility to pull starters early, and rested relief arms limit scoring spikes from a bad inning by either starter.
  • Rafael Devers (.244/.315/.476, 21 HR, 0.915 vR OPS) is the primary power threat against Johnson's extreme home-run rate. Oracle's 0.85 HR factor moderates the ceiling but does not neutralize a pitcher surrendering homers at 2.35 per nine.
  • The exchange shows Angels pricing near -103 on the alternate moneyline market, signaling sharp two-way action. Ray's walk rate is the root cause. If he loses the zone early and Angels hitters begin to reach base, the near-even money on Los Angeles becomes live value against the grain.

Los Angeles Angels vs San Francisco Giants Betting Picks

Picks made July 25, 2026 at 05:37 AM ET. Odds shown reflect current market prices.

Los Angeles Angels +1.5 (-195) [MEDIUM confidence>
Los Angeles Angels +1.5 (-195) [MEDIUM confidence>: Both offenses rank bottom-20 in wRC+ and neither starter projects as a dominant run-suppressor through seven innings. A 1.5-run cushion covers the Angels even in a Giants win, and Johnson's recent cleaner outing (5 IP, 1 ER vs DET) shows he can limit damage when his command holds. With margins expected to be tight between two struggling clubs, the run line is a more structured play than either side on the moneyline.
Under 8.5 (-105) [LOW confidence>
Under 8.5 (-105) [LOW confidence>: Oracle Park's run factor (0.93) and HR factor (0.85) suppress scoring structurally against two bottom-20 offensive units. The caveat is real: Ray's walk rate (4.39 BB/9) and Johnson's HR rate (10 HR in 38.1 IP) are competing pressures that push in the opposite direction. This is a weak signal, not a conviction play. The park does the heavy lifting and the offenses cooperate, or this number is in danger by the fifth inning.
Robbie Ray Under 6.5 strikeouts (-167) [MEDIUM confidence>
Robbie Ray Under 6.5 strikeouts (-167) [MEDIUM confidence>: Ray's 2026 K/9 is 7.82 (96 K in 110.2 IP), but his last three starts tell a different story: 6 K in 4 innings, 4 K in 5 innings, 4 K in 6 innings. That averages to 4.67 strikeouts per outing. His outs line at 15.5 implies roughly 5-plus innings, which at his current K pace projects to around 4 strikeouts. The market prices the Under at -167 (62.5% implied), consistent with recent output. The Angels ranking 20th in wRC+ does not help the over side.
Jorge Soler Under 0.5 hits (+116) [MEDIUM confidence>
Jorge Soler Under 0.5 hits (+116) [MEDIUM confidence>: Soler's career line against Ray across 10 plate appearances spanning four seasons (2016, 2021, 2022, 2024) reads .143 average, 0.543 OPS. This is not a single bad game. His 2026 season average is .205 with a vL OPS of 0.599, showing general difficulty against left-handed pitching beyond the BvP sample alone. Getting plus money against a documented multi-year pattern against a specific pitcher represents genuine positive expected value.
Drew Gilbert Under 0.5 hits (+104) [MEDIUM confidence>
Drew Gilbert Under 0.5 hits (+104) [MEDIUM confidence>: Gilbert's vL OPS of 0.101 against left-handed pitchers is not a slump. It is a structural platoon collapse that makes him essentially non-functional as a contact hitter against southpaws. He faces Robbie Ray today. The market pricing the Under at +104 undervalues a severe and durable matchup disadvantage, especially in a park that already suppresses offense.
Rafael Devers to hit a home run (+320) [MEDIUM confidence>
Rafael Devers to hit a home run (+320) [MEDIUM confidence>: Johnson has allowed 10 home runs in 38.1 innings, one of the worst HR rates in baseball this season. Devers (.244/.315/.476, 21 HR) carries a vR OPS of 0.915 and is the Giants' primary power bat against right-handed pitching. Oracle Park's 0.85 HR factor moderates the ceiling but does not neutralize a 2.35 HR/9 pitcher. At +320 (23.8% implied), there is real value relative to the matchup risk Johnson presents to any legitimate power hitter.
Zach Neto Over 1.5 total bases (+100) [LOW confidence>
Zach Neto Over 1.5 total bases (+100) [LOW confidence>: Neto's vL OPS of 0.883 gives him a meaningful platoon advantage against Ray. His 2026 line of .238/.327/.449 with 19 home runs confirms legitimate extra-base capability. No career BvP data exists against Ray, which limits conviction. Getting even money with a demonstrable left-side platoon edge is marginal positive value. Treat this as a speculative add, not a core position.
SGP (4 legs)
SGP (4 legs): Giants ML (-143) + Under 8.5 (-105) + Robbie Ray Under 6.5 strikeouts (-167) + Jorge Soler Under 0.5 hits (+116). The thesis is internally consistent: a Giants win in a low-total game is reinforced by Ray pitching efficiently through contact rather than strikeouts, and Angels hitters like Soler failing to reach base. All four outcomes point toward the same tight, pitcher-controlled script at Oracle Park.
Analysis insight — no specific bet associated

Key Players

Batting AverageLAA
Nolan Schanuel
.282Batting Average
1B
Home RunsLAA
Zach Neto
19Home Runs
SS
Runs Batted InLAA
Jo Adell
57Runs Batted In
RF
Earned Run AverageLAA
Jose Soriano
3.43Earned Run Average
SP
WinsLAA
Jose Soriano
8Wins
SP
StrikeoutsLAA
Reid Detmers
136Strikeouts
SP
Batting AverageSF
Luis Arraez
.324Batting Average
2B
Home RunsSF
Rafael Devers
21Home Runs
1B
Runs Batted InSF
Rafael Devers
56Runs Batted In
1B
Earned Run AverageSF
Robbie Ray
3.33Earned Run Average
SP
WinsSF
Robbie Ray
8Wins
SP
StrikeoutsSF
Landen Roupp
113Strikeouts
SP

Recent Form

Los Angeles Angels
W3-2Detroit Tigers
W3-2St. Louis Cardinals
W5-1St. Louis Cardinals
L1-0St. Louis Cardinals
San Francisco Giants
L6-3Seattle Mariners
L4-3Kansas City Royals
L3-2Kansas City Royals
L5-4Kansas City Royals

Los Angeles Angels vs San Francisco Giants Summary

The context drives every pick in this game. Oracle Park on a Saturday afternoon with cold bay air, two bottom-20 offenses by wRC+, and a left-handed starter with a concrete matchup advantage against an Angels club that has not solved LHPs all season. The Giants lean on the moneyline is not about Ray being dominant. It is about Los Angeles facing two layered disadvantages: a southpaw and a suppressive park, against a lineup construction that has struggled with both all year. That is not a narrative. It is a season-long pattern with 28 games of evidence behind it.

The best-structured play is the Angels +1.5 run line at -195. These are two limited offenses with a thin projected margin, and a 1.5-run cushion gives Los Angeles a path to cash even in a Giants win. Under 8.5 at -105 is the softer companion, with the park doing the majority of the work. On the props side, the Soler Under 0.5 hits at +116 is the sharpest value bet, a multi-year BvP pattern against Ray that the market is pricing too generously for the over side. The Devers home-run play at +320 is the highest-ceiling speculative add, a power bat versus one of the most homer-prone starters in baseball.

The caveat is Ray's walk rate, and it is not a small one. A 4.39 BB/9 means a bad inning is never more than two walks away. If he loses the zone early, the total climbs past 8.5, Johnson's recent improvement looks like noise rather than a trend, and Angels ML near even money becomes the better position than anything on the Giants side. Baseball punishes certainty. The environment and splits point toward San Francisco, but this game has a real 50-50 heartbeat if Ray cannot find the zone. For the full slate, see our MLB picks today, NRFI picks, and player props.

Head-to-Head History

Season SeriesSF leads series 1-0
DateMatchupResult
Jul 25, 2026LAA @ SFSFSF 7-6

Angels vs Giants predictions: Giants ML (-143) is our lean as LAA is 10-18 vs LHP. Ray faces Angels at Oracle Park with Under 8.5 (-105) in play.

Frequently Asked Questions

MLBGame PreviewsLos Angeles Angels at San Francisco Giants
